Growth Chart Calculator

WHO and CDC references

Growth ChartsMay 13, 2026Updated May 13, 20268 min read

5 Things Parents Get Wrong About Growth Percentiles

Reviewed by our editorial team

At your child's checkup, the doctor says your son is at the 25th percentile for weight. You nod, but inside you're wondering whether that number should be higher. That confusion is extremely common. This article breaks down five of the biggest growth chart myths parents carry into the exam room and shows what pediatricians actually care about instead.

growth chart percentile misconceptions infographic with five parent myths about child growth percentiles

Author

Editorial Team, GrowthChartCalculator.org

Reviewed for medical accuracy against WHO, CDC, and standard pediatric growth-monitoring guidance.

Table of Contents+

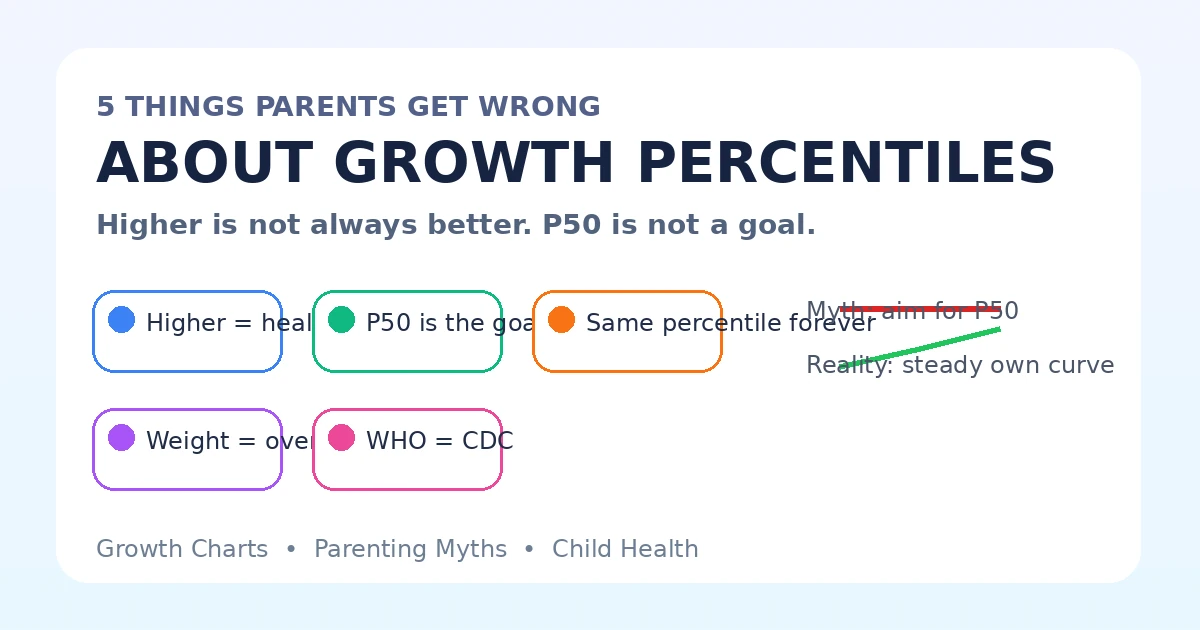
Myth #1: Higher Percentile = Healthier Child

This is probably the most common growth chart misunderstanding. Parents often hear a high percentile and feel relieved, or hear a lower percentile and feel disappointed. But percentile is not a health score. It is a position on a distribution.

A child at the 95th percentile is not automatically healthier than a child at the 25th percentile. The bigger child is simply larger relative to peers on that chart. Health depends on growth pattern, nutrition, activity, medical history, and proportion, not on being “more percentile.”

That is why a weight percentile calculator should be used as a reference tool, not a scoreboard. Many healthy children live comfortably at the low end or high end of the normal range for years.

Myth #2: The 50th Percentile Is the "Goal"

The 50th percentile is only the midpoint. It is not the target every child should aim for. If both parents are naturally smaller or leaner, a child who tracks steadily at the 20th percentile may be exactly where genetics would predict.

Important context

A child consistently at the 20th percentile who is active, healthy, and eating well is not automatically underweight. They may simply be smaller than average.

This is one reason pediatricians care so much about family pattern. When parents treat P50 as the goal, they often worry about perfectly normal children and miss the more useful question: is this child growing in a way that is steady and proportionate for them?

Myth #3: My Child Should Stay on the Same Percentile

Another common mistake is assuming a healthy child must stay fixed on one exact percentile forever. In reality, early life is full of adjustment. Babies often show catch-up or catch-down growth, toddlers can look leaner after they start walking, and puberty can temporarily move children across bands.

The more realistic goal is not a frozen number. It is a reasonably stable trend over time without a persistent downward or upward slide. If this myth feels familiar, read our companion guide on why did my child's percentile drop, which explains when movement is ordinary and when it deserves a closer look.

Myth #4: Percentile Tells You If Your Child Is Overweight

Weight percentile alone cannot tell you whether a child is overweight. A taller child may naturally have a higher weight percentile without having excess body fat. That is why clinicians use BMI-for-age after age 2 when the question is overweight or obesity screening.

Warning

Never use weight percentile alone to assess overweight. Use BMI-for-age instead, because it accounts for both weight and height.

If a parent sees a weight percentile in the 90s and panics, the missing question is usually “how tall is the child?” Use the BMI percentile calculator before drawing conclusions.

Myth #5: WHO and CDC Charts Are Interchangeable

WHO and CDC charts are related, but they are not interchangeable. WHO standards are based on children growing under favorable international conditions and are used for children under 2 in U.S. practice. CDC charts are based on U.S. survey data and are commonly used after age 2.

That means the same child can land on slightly different percentiles depending on which chart is used. A baby who looks like P60 on one standard might look like P55 on another. That difference does not mean the child changed overnight. It means the reference population changed.

Our growth chart calculator lets you switch standards directly, which makes this distinction much easier to see.

What Actually Matters: The Trend, Not the Number

If there is one idea parents should keep from this article, it is this: pediatricians watch the lane, not the dot. A child who stays around the 10th percentile with normal energy, normal intake, and a matching family pattern may be growing beautifully. A child who slides from the 50th percentile to the 10th percentile over repeat visits may deserve more attention even though both percentiles are still on the chart.

This is the difference between percentile and normal. Normal is not one number. Normal is a sustainable pattern that makes sense in the context of the child's age, sex, family build, and overall health.

How to Use Growth Charts the Right Way

Parents do best with growth charts when they use them as a tracking tool instead of a report card.

  • ✅ Record each well-visit measurement and compare at least 3 to 6 months of trend.
  • ✅ Compare height and weight together so you can see whether they stay proportionate.
  • ✅ Use WHO under age 2 and CDC after age 2 unless your clinician gives a specific exception.
  • ✅ Ask your pediatrician questions directly instead of translating the percentile into a judgment.
  • ❌ Do not treat percentile like a grade or achievement badge.
  • ❌ Do not overreact to one small movement, especially in infancy or around illness.

If you want to compare age-specific expectations, a page like average weight for a 3 year old can provide context, but the real test is whether the long-term pattern on the child growth chart remains coherent.

Frequently Asked Questions

No. The 50th percentile simply marks the midpoint of the reference chart. Any percentile between the lower and upper reference bands can be normal. What matters most is whether your child grows consistently along their own curve.

Medical disclaimer

This article is for educational use only. Growth charts help organize measurements, but they do not replace medical evaluation. If your child's pattern changes quickly or seems out of range, discuss it with your pediatrician.

Tags

Growth ChartsPercentilesParenting MythsChild Health

Editorial Review

Content is maintained by our editorial team and reviewed against primary WHO and CDC growth references. Last reviewed site-wide on March 18, 2026.